

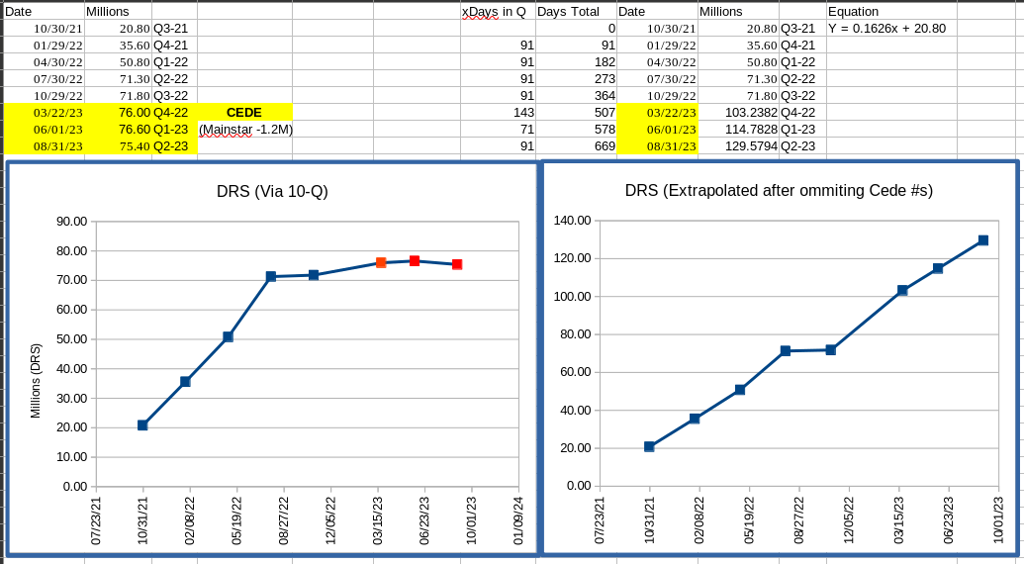
DRS in Millions (10-Q & 10-K)
- 10/30/21 20.80
- 01/29/22 35.60
- 04/30/22 50.80
- 07/30/22 71.30
- 10/29/22 71.80
- 03/22/23 76.00
- 06/01/23 76.60
- 08/31/23 75.40
DRS in Millions (What if Cede Would Lie?)
- 10/30/21 20.80
- 01/29/22 35.60
- 04/30/22 50.80
- 07/30/22 71.30
- 10/29/22 71.80
- 03/22/23 103.2382
- 06/01/23 114.7828
- 08/31/23 129.5794
It might be hard to visualize, but the last 3 fake data points do include a smaller slope by including the data point where we “only” added 0.5M in October of 2022.
But what if Cede fucked with the reporting for October specifically, knowing that the last 2 real data points (71.3 and 71.8) would only show a slope of ~0.5M a quarter?
Why do youyouyou think Gamestop changed the wording from 03/22/2023 onward?
Further ruminating, using very conservative numbers.
Not even using 200,000 Computershare accounts. Say just 100,000 accounts.
Is it a stretch to say 100,000 accounts DRS 5 shares a month? 100,000 x 5 shares a month x 3 months = 1,500,000 a quarter
5 shares a month * $22 avg = $110 a month * 3 months = $330 a quarter
Or only 1 to 3 shares a month for 200,000 accounts:
Those are very reasonable (and very conservative) numbers.
As the quarters continue, I think it will become much more apparent that the wording change changed something significant.