

- cross-posted to:
- memes@lemmy.ml
- cross-posted to:
- memes@lemmy.ml
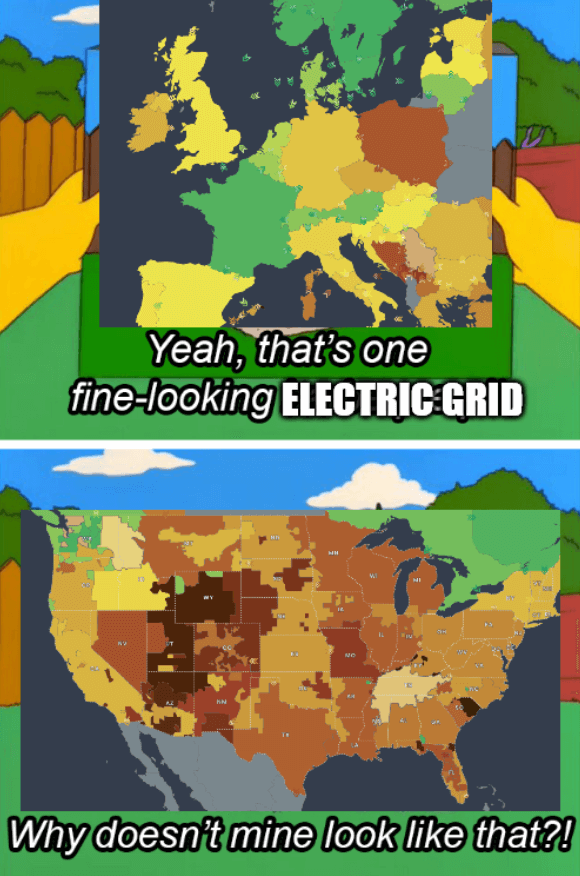
Source - The colors of the grids represent CO2 emissions
The title is a reference to the 2021 Texas power crisis
Source - The colors of the grids represent CO2 emissions
The title is a reference to the 2021 Texas power crisis
Yes, the map sources try to include the CO2 emissions of all the chain.
When doing that you see that nuclear still has very low emissions. Nuclear is a lot of CO2 emissions for construction but after that there is not much. The fact that most of the French nuclear reactor are almost 40 years old means that the impact of construction is already diluted.
Uranium mining is polluting, yes, but you need so little that it does not really have a big impact on the CO2/kWh ratio. 1kg of natural uranium produce as much energy as 14,000kg of coal !
What is interesting on this map is that right now the green countries either have a lot of nuclear, a lot of hydroelectricity or both. Country with a lot of wind and solar struggle to meaningfully lower their CO2 emissions. I think it will come but right now the backup power used for when solar and wind production are low is often polluting and counterbalance the low emissions of renewable energy.
Spain has lots of solar and wind and is fairly green.
The yearly average for Spain in 2023 is 160g CO2/kWh (yellow).
25% of their electricity was produced with wind, 22% nuclear, 16% solar and 10% hydro. And also 22% of gas that brought their CO2 up.