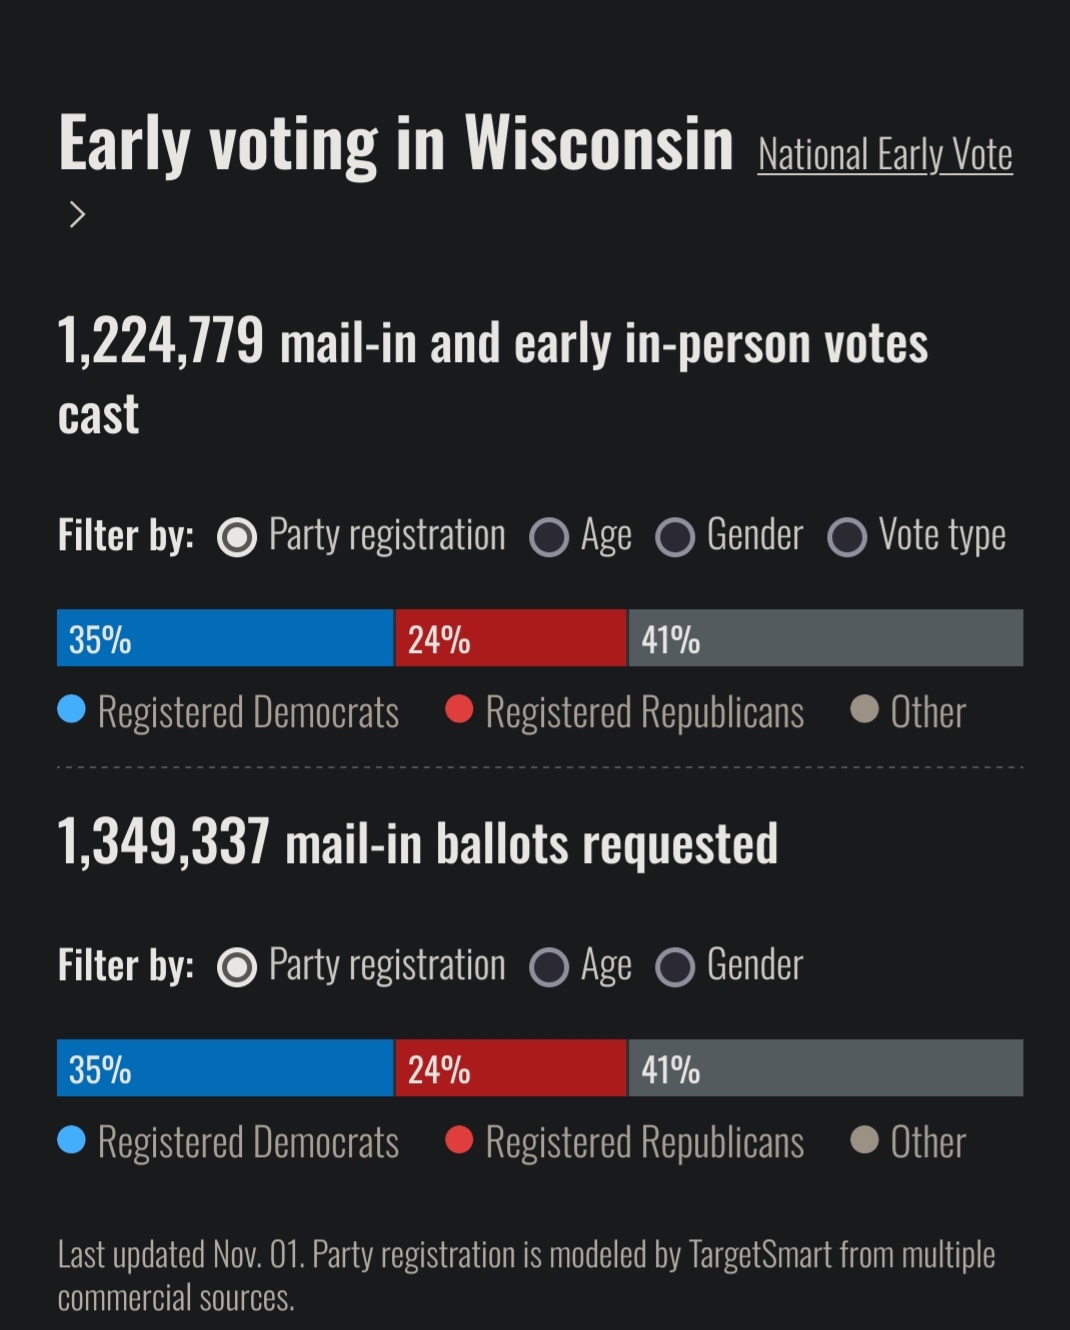
Wisconsin doesn’t have party registrations as part of voter registration (we used to, back when I first registered, which is likely why there’s some partisan representation, but not for a long time), nor do you need to be registered with a party to vote in the primaries (everything is on one ballot, you can just only vote for one party).
So that huge chunk of “independent” is probably “new” registrations from the last 15 or so years. They just don’t have data because it stopped being a tracked metric.
“other” is the catch all for anyone whose not registered as democrat or republican. It includes independents, yes, but it also includes all the 3rd parties and the people who simply didn’t register one way or other (who might be repub or dem, anyhow).
And people who’ve registered with a party are more likely to be proactive voters. Honestly there’s so many complaicating factors here that trying to interpret this data is folly.
wtf? are these data random generated? they don’t make sense.
there is 40% of republicans in 62 millions casted votes (so roughly 25 million)
and suddenly 30% in the 63 million (roughly 19 million?) requested ballots?
either i am missing something, or these data are so imprecise that trying to analyse them is a fools errand.
About half the states allow same-day voter registration, so there may be people who voted but did not specifically request mail in/early voting, and those who did request but have not cast their vote yet. So, for many states you could be in one set but not the other.
Live Data https://www.nbcnews.com/politics/2024-elections/early-vote
that… 19% of “other” is going to be doing a lot of work here. if we assume they’re 50/50, then I take this as, overall, good news.
deleted by creator
I think it’s Independent.
The Wisconsin breakdown is bonkers.
Wisconsin doesn’t have party registrations as part of voter registration (we used to, back when I first registered, which is likely why there’s some partisan representation, but not for a long time), nor do you need to be registered with a party to vote in the primaries (everything is on one ballot, you can just only vote for one party).
So that huge chunk of “independent” is probably “new” registrations from the last 15 or so years. They just don’t have data because it stopped being a tracked metric.
“other” is the catch all for anyone whose not registered as democrat or republican. It includes independents, yes, but it also includes all the 3rd parties and the people who simply didn’t register one way or other (who might be repub or dem, anyhow).
Yes, I am registered as unaffiliated, because I don’t see why the political party I support needs to be publicly accessible.
And people who’ve registered with a party are more likely to be proactive voters. Honestly there’s so many complaicating factors here that trying to interpret this data is folly.
Oh yeah. I don’t for a second believe it’s going to fall out to 50/50 on a perfect split.
Anyone telling you anything except that it’s too close to call, is selling you something.
But let me huff my copium, okay?
wtf? are these data random generated? they don’t make sense.
there is 40% of republicans in 62 millions casted votes (so roughly 25 million) and suddenly 30% in the 63 million (roughly 19 million?) requested ballots?
either i am missing something, or these data are so imprecise that trying to analyse them is a fools errand.
About half the states allow same-day voter registration, so there may be people who voted but did not specifically request mail in/early voting, and those who did request but have not cast their vote yet. So, for many states you could be in one set but not the other.