
For some years now, I have seen this graph go around on social media. I think it’s a powerful image, because it shows us so clearly that it is happening in our lifetime and under our watch.
But when I use it in my work, I always add the disclaimer the the graph does not show when it was made.
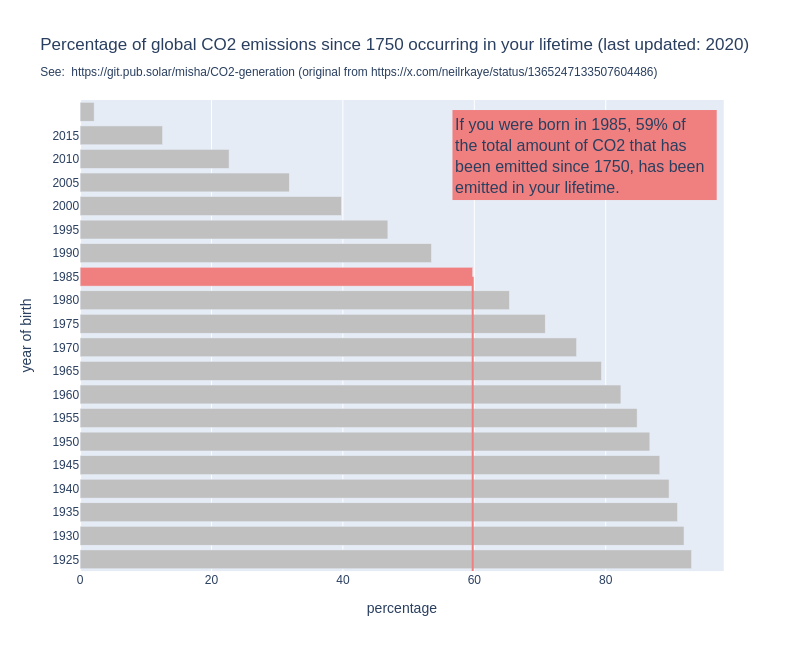
Because that is a problem: the graph might show us that if you are currently 30 years old, 50% of all the CO2 that has been emitted since 1751 has been emitted in your lifetime. But that percentage changes over time.
By now, for people who are currently 30, the percentage will be higher, simply because the annual emissions have gone up since the graph was made.
So I made a new version of the graph, the interactive version of which you can find here: http://mishathings.org:8050/
I wrote a post about this: https://mishathings.org/2024-08-12-how-much-co2-has-been-emitted-in-my-lifetime.html
If you are 273 it is about 100%
Yes this graph makes way more sense. The original graph had no base, age is arbitrary to events over time without a date of birth. So if you were born in 1751 and were 5 years old the original says 11% of all emissions happened in your lifetime. It also say if you were born in 2019 and were 5 years old that 11% of all emissions happened in your lifetime. It has static measurements across time when yearly emissions aren’t static.
I would have hoped, with the fact that I’ve been hearing about how dangerous global warming and later climate change is for as long as I can remember, that percentage would have been lower. We really weren’t doing anything to help for the longest time, and now we aren’t doing enough.
we aren’t doing enough.
Because a lot of people aren’t doing anything to help.
The graph wants to highlight you and connect the data with you. You could’ve simply shown that we’ve produced this much in the past 30 years. It is even the same graph but another interpretation. It is the same. You corrected that 🥰
What I don’t like is that we always put time on the x axis. Always. There is no reason to put it on the y axis for this plot.
And then, you start 100 years ago where it was 5%, etc. And the data increases over time, instead of decreasing.
The title is misleading. It’s not in your lifetime. It means in the readers lifetime. The graph show’s you and not me. You updated that in your graph which is awesome 🥰
Time doesn’t always go on the x-axis, but it is expected that the “independent” variable goes there, which is time in this case. This orientation does make it a lot more readable on mobile though in portrait mode, but the slider is unreadable in the mode. Which means it should probably assume landscape mode anyways, in which case x=year would be better. Given the “x-axis” is at the top on the original, I think you are intended to look at it sideways (like a full page landscape graph in print form), such the the left side is the x-axis? But the %s being at the bottom of the new one make it harder to see that label (on mobile at least) and changes what is the implied x and y axis.
But if the independent variable was “words in a book” and you were using that to predict time needed to complete the book, time should be on the y-axis.
Thank you!! This was bugging the shit out of me as well.
Who rotates a CDF like this???
Thank you for sharing, impressive work!
Gotta get that amount of co2 up guys, gotta start driving at 5


